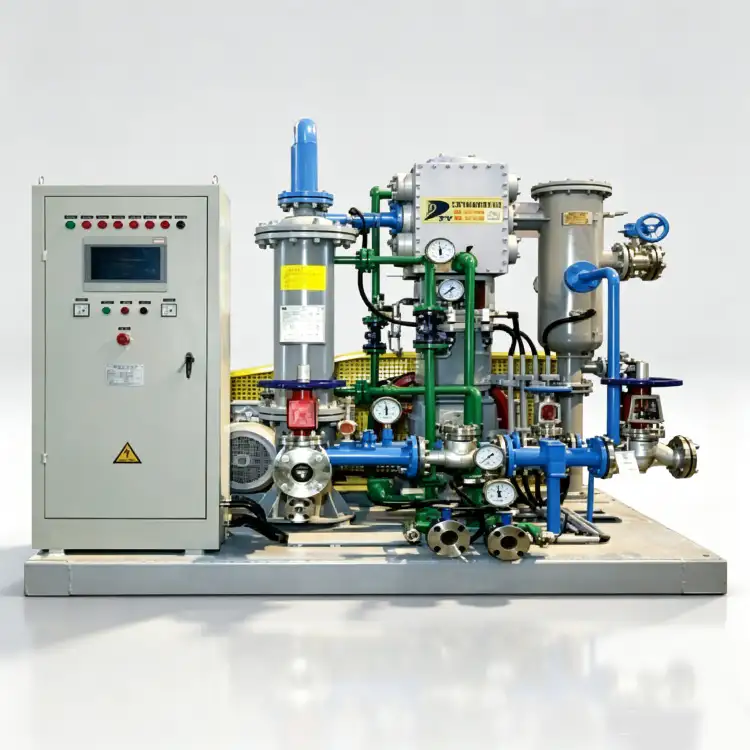
Biznesowy argument za modernizacją sprężarek azotowych
Zakłady przemysłowe zajmujące się przetwórstwem chemicznym, produkcją farmaceutyczną, pakowaniem żywności i produkcją elektroniki wykorzystują sprężarki azotu, które zużywają więcej energii, wymagają częstszej konserwacji i zapewniają mniej niezawodną pracę niż nowoczesne alternatywy. Decyzja o modernizacji to nie tylko wydatek kapitałowy – to strategiczna inwestycja o wymiernych korzyściach. Niniejszy przewodnik zapewnia rygorystyczne ramy dla Obliczanie zwrotu z inwestycji (ROI) przy modernizacji do wydajnych sprężarek azotowychwykraczając poza proste okresy zwrotu na rzecz kompleksowej analizy finansowej, która uwzględnia oszczędności energii, redukcję konserwacji, wzrost wydajności i ograniczanie ryzyka.
Przedstawiona tutaj metodologia jest przeznaczona dla dyrektorów finansowych, kierowników zakładów i dyrektorów ds. inżynierii, którzy muszą uzasadniać projekty inwestycyjne przed zarządami, inwestorami i centralami firm. Dostarcza ona narzędzi analitycznych, które pozwalają przekształcić specyfikacje techniczne sprężarek w przekonujące analizy biznesowe z możliwymi do obrony prognozami finansowymi.
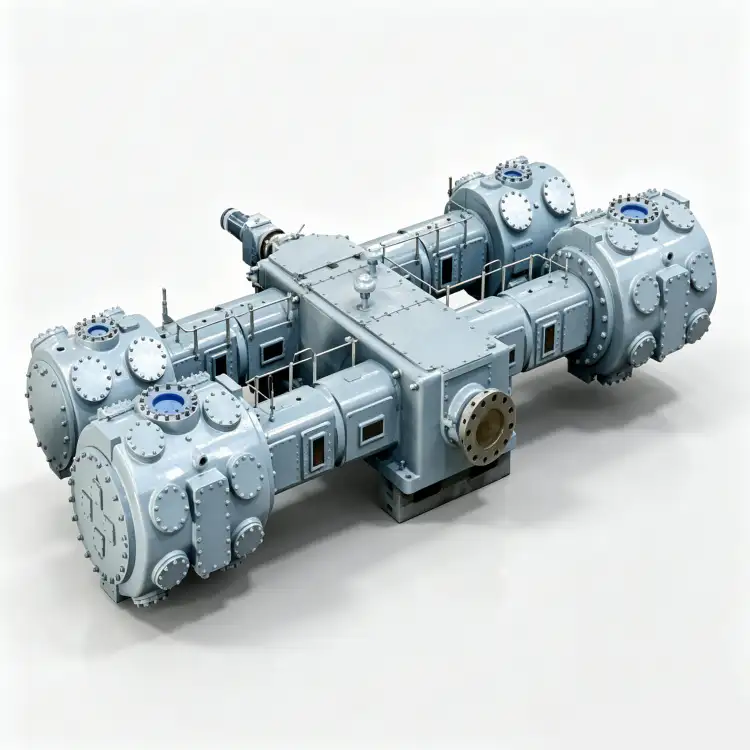
Zrozumienie rzeczywistych kosztów eksploatacji starzejących się sprężarek azotowych
Przed obliczeniem zwrotu z inwestycji w modernizację, zarządcy obiektów muszą zrozumieć pełne koszty związane z istniejącym sprzętem do sprężania azotu. Cena zakupu oryginalnej sprężarki, często w pełni amortyzowana po 10-15 latach, staje się nieistotna. Liczą się roczne koszty operacyjne, które rok po roku pochłaniają budżet na konserwację i rachunki za energię.
Wzrost kosztów energii: Starzejące się sprężarki tracą wydajność z powodu zużycia, zanieczyszczeń i przestarzałej konstrukcji. Sprężarka, która dostarczała 0,18 kWh/Nm³ w stanie nowym, może zużywać 0,24–0,28 kWh/Nm³ po 15 latach eksploatacji. W przypadku obiektu zużywającego 2 000 000 Nm³ rocznie przy zużyciu $0,12/kWh, spadek wydajności zwiększa roczne koszty energii o $144 000–$240 000 w porównaniu z nową, prawidłowo konserwowaną jednostką. W 20-letniej prognozie, przy założeniu rocznej inflacji na poziomie 3%, skumulowane koszty energii elektrycznej starzejącej się sprężarki mogą przekroczyć $4 mln.
Inflacja kosztów utrzymania: Wraz ze starzeniem się sprężarek, częstotliwość i koszty konserwacji rosną nieliniowo. Okresy między wymianami zaworów skracają się z 8000 do 4000 godzin. Zużycie pierścieni tłokowych przyspiesza. Łożyska wymagają częstszej wymiany. Wzrasta zużycie oleju. Dostępność części zamiennych do przestarzałych modeli maleje, co wymusza kosztowne niestandardowe wykonanie lub długie terminy realizacji. Sprężarka, której utrzymanie kosztuje $15 000 rocznie w 5. roku, może kosztować $35 000–$50 000 rocznie po 15. roku. Krzywa kosztów konserwacji ma charakter wykładniczy, a nie liniowy.
Przestoje i straty produkcyjne: Starzejące się sprężarki ulegają awariom częściej i w sposób nieprzewidywalny. Każde nieplanowane zatrzymanie przerywa produkcję, uruchamia awaryjną konserwację i może wymagać wypożyczenia sprężarki po wyższych stawkach. W przemyśle ciągłym, pojedyncza 24-godzinna przerwa w dostawie azotu może zniszczyć partie produktów o wartości $100 000–$500 000, naliczyć kary dla klientów oraz wymagać kilkudniowego ponownego uruchomienia i ponownej kwalifikacji. Koszt przestoju jest często największym ukrytym kosztem eksploatacji starzejącego się sprzętu.
Ryzyko regulacyjne i zgodności: Starsze sprężarki mogą nie spełniać obecnych norm emisji, hałasu lub bezpieczeństwa. Modernizacja do nowoczesnego sprzętu z aktualnymi certyfikatami (CE, PED, ATEX, ISO 8573-1) eliminuje ryzyko regulacyjne i może kwalifikować się do premii za efektywność energetyczną lub kredytów na redukcję emisji dwutlenku węgla. Koszty niezgodności – grzywny, utrata ubezpieczenia i ograniczenia operacyjne – mogą przekroczyć koszt wymiany.
Punkt odniesienia dla kalkulacji zwrotu z inwestycji (ROI) musi uwzględniać wszystkie te czynniki kosztowe, a nie tylko oszczędności energii. Kompleksowy punkt odniesienia odzwierciedla rzeczywisty ciężar finansowy obecnego stanu rzeczy, co sprawia, że modernizacja jest przekonująca, nawet gdy prosty zwrot z inwestycji wydaje się marginalny. Dla obiektów poszukujących analiza modernizacji sprężarki azotu przez ekspertaNajbardziej wartościowym pierwszym krokiem jest przeprowadzenie szczegółowego audytu kosztów istniejącego sprzętu.
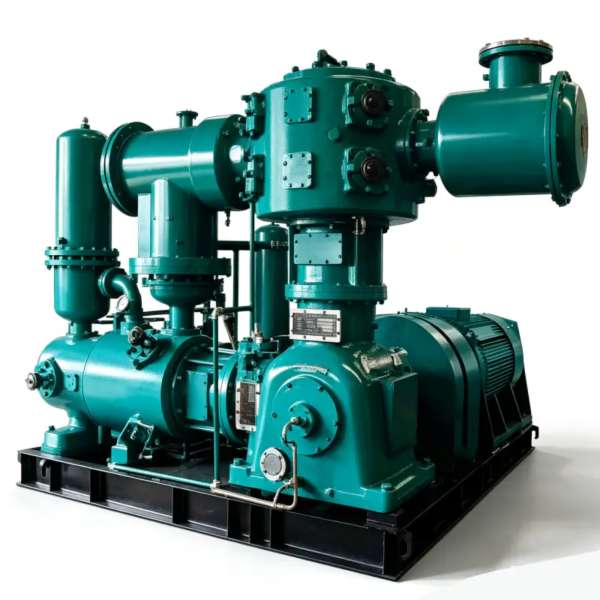
Oszczędność energii: główny czynnik wpływający na zwrot z inwestycji w modernizację
Zużycie energii ma decydujący wpływ na koszty cyklu życia sprężarki azotu, stanowiąc 70–80% całkowitego kosztu posiadania. Oszczędności energii są zatem głównym czynnikiem wpływającym na zwrot z inwestycji w modernizację, a ich kwantyfikacja musi być rygorystyczna i uzasadniona.
Porównanie jednostkowego zużycia energii: Kluczowym wskaźnikiem jest jednostkowe zużycie energii (SEC), wyrażone w kWh na Nm³ sprężonego azotu. Nowoczesne, wydajne sprężarki osiągają wartości SEC o 15–30% niższe niż urządzenia sprzed 10–15 lat. Typowe usprawnienia:
| Technologia kompresorowa | Typowa SEC (starsza wersja) | Typowy SEC (nowoczesny) | Poprawa wydajności |
|---|---|---|---|
| Posuwisto-zwrotny (30 barów) | 0,22 – 0,28 kWh/Nm³ | 0,18 – 0,22 kWh/Nm³ | 15 – 25% |
| Śruba (10 bar) | 0,18 – 0,24 kWh/Nm³ | 0,14 – 0,18 kWh/Nm³ | 18 – 28% |
| Odśrodkowy (50 barów) | 0,16 – 0,22 kWh/Nm³ | 0,12 – 0,16 kWh/Nm³ | 20 – 30% |
| Śruba wyposażona w VSD | 0,20 – 0,26 kWh/Nm³ (prędkość stała) | 0,15 – 0,19 kWh/Nm³ (zmienna prędkość) | 22 – 32% |
Udoskonalenia te są efektem wielu osiągnięć technologicznych: zoptymalizowanych współczynników sprężania, udoskonalonych konstrukcji zaworów i portów, mniejszych tolerancji produkcyjnych, zaawansowanych środków smarnych oraz napędów o zmiennej prędkości, które dopasowują moc wyjściową do zapotrzebowania, zamiast przełączać się między pełnym obciążeniem i bez obciążenia.
Roczne obliczenie oszczędności energii: Oblicz roczne oszczędności energii, używając:
Roczne oszczędności = Roczna objętość azotu × (SEC_legacy – SEC_new) × Stawka za energię elektryczną
W przypadku obiektu zużywającego 3 000 000 Nm³/rok modernizacja starej sprężarki tłokowej o zużyciu 0,25 kWh/Nm³ do nowoczesnej jednostki o zużyciu 0,19 kWh/Nm³ i zużyciu energii elektrycznej na poziomie $0,12/kWh:
Roczne oszczędności = 3 000 000 × (0,25 – 0,19) × 0,12 = $216 000 rocznie
W ciągu 20 lat, przy rocznej inflacji cen energii elektrycznej wynoszącej 3%, skumulowane oszczędności energii przekraczają $5,8 miliona.
Wzrost wydajności przy obciążeniu częściowym: Wiele zakładów korzysta ze sprężarek przy częściowym obciążeniu przez znaczną część roku. Tradycyjne sprężarki o stałej prędkości obrotowej wykorzystują nieefektywne sterowanie obciążeniem/odciążeniem, zużywając 60–70% mocy przy pełnym obciążeniu w stanie bez obciążenia. Nowoczesne sprężarki VSD zmniejszają prędkość obrotową dostosowując ją do zapotrzebowania, zużywając energię proporcjonalnie do przepływu. Przy obciążeniu 50% sprężarka VSD może zużywać 45–55% mocy przy pełnym obciążeniu, w porównaniu z 65–75% w przypadku jednostki o stałej prędkości obrotowej z obciążeniem/odciążeniem. W zakładach o zmiennym profilu zapotrzebowania, wzrost sprawności przy częściowym obciążeniu może przewyższać wzrost sprawności przy pełnym obciążeniu.
Wartość odzysku ciepła: Nowoczesne sprężarki odbierają 60–80% energii wejściowej w postaci ciepła. Przechwytywanie tego ciepła do ogrzewania pomieszczeń, podgrzewania wody procesowej lub chłodzenia absorpcyjnego zmniejsza koszt energii netto. Sprężarka o mocy 100 kW oddaje około 70 kW ciepła. Jeśli 50% tego ciepła zostanie odzyskane do ogrzewania obiektu w ilości ekwiwalentu $0,05/kWh, roczna wartość odzysku ciepła wynosi:
70 kW × 0,50 × 8000 godzin × $0,05/kWh = $14 000 rocznie
Systemy odzysku ciepła zwiększają nakłady inwestycyjne o kwotę $5000–$15000, ale zwracają się w ciągu 1–2 lat w obiektach zużywających dużo ciepła.
Redukcja kosztów utrzymania: drugorzędny czynnik zwrotu z inwestycji (ROI)
Podczas gdy oszczędność energii dominuje w ekonomii modernizacji, redukcja kosztów konserwacji zapewnia znaczący dodatkowy zysk, który wzmacnia argumenty biznesowe. Nowe sprężarki o nowoczesnej konstrukcji, ulepszonych materiałach i funkcjach monitorowania predykcyjnego zmniejszają zarówno częstotliwość konserwacji, jak i koszt pojedynczego zdarzenia.
Zmniejszona częstotliwość konserwacji: Nowoczesne konstrukcje sprężarek wydłużają żywotność podzespołów dzięki zastosowaniu lepszych materiałów, precyzyjnej produkcji i zoptymalizowanych warunków pracy:
- Zaawansowane materiały zaworów (stal nierdzewna, PEEK, powłoki ceramiczne) wydłużają żywotność zaworów z 4000–6000 godzin do 8000–12 000 godzin
- Ulepszone materiały pierścieni tłokowych (kompozyty z włókna węglowego, zaawansowane formuły PTFE) wydłużają żywotność pierścieni o 30-50%
- Precyzyjna produkcja wirników w sprężarkach śrubowych zmniejsza zużycie bloku sprężarki, wydłużając okresy między przeglądami z 40 000 do 60 000–80 000 godzin
- Konstrukcje bezolejowe całkowicie eliminują konieczność konserwacji związanej z olejem (wymiany, wymiana filtrów, serwis separatora)
Technologia konserwacji predykcyjnej: Nowoczesne sprężarki integrują monitorowanie drgań, analizę oleju i trendy wydajności, które pozwalają przewidywać awarie podzespołów przed ich wystąpieniem. To przesuwa konserwację z reaktywnej (naprawa po awarii) na predykcyjną (wymiana przed awarią), zmniejszając zarówno koszty konserwacji, jak i nieplanowane przestoje. Dane terenowe wskazują, że konserwacja predykcyjna zmniejsza koszty konserwacji o 20–30% i nieplanowane przestoje o 40–50% w porównaniu z konserwacją zapobiegawczą opartą na czasie w starszych urządzeniach.
Dostępność części zamiennych: Starsze sprężarki pochodzące od nieistniejących producentów lub z przestarzałych linii produktów borykają się z problemami z dostępnością części. Produkcja na zamówienie, długie terminy realizacji i wysokie ceny zwiększają koszty utrzymania. Nowoczesne sprężarki od aktywnych producentów z regionalną dystrybucją części zapewniają szybką dostępność części w konkurencyjnych cenach. Niższe koszty utrzymania zapasów i wyeliminowanie dodatkowych kosztów związanych z zakupami awaryjnymi zwiększają oszczędności na kosztach utrzymania w typowych instalacjach przemysłowych o $5000–$15000 rocznie.
Obliczanie oszczędności na konserwacji: Oszacuj oszczędności na konserwacji, porównując przewidywane koszty konserwacji nowego sprzętu z rzeczywistymi kosztami konserwacji istniejącego sprzętu w perspektywie 10 lat. Uwzględnij robociznę, części, usługi serwisowe i koszty ogólne. Typowa redukcja kosztów konserwacji o 25–40% jest możliwa do osiągnięcia przy modernizacji sprzętu starszego niż 15 lat na nowoczesne rozwiązania. Dla zakładu wydającego $40 000 rocznie na konserwację sprężarek, redukcja o 30% daje roczne oszczędności w wysokości $12 000 – $120 000 w ciągu 10 lat.
Kwantyfikacja ryzyka przestoju i wzrostu produktywności
Koszty przestoju są często najważniejszym, a jednocześnie najmniej wymiernym czynnikiem wpływającym na zwrot z inwestycji w modernizację. Starzejące się sprężarki ulegają nieprzewidywalnym awariom, zakłócając produkcję i generując koszty, które przewyższają oszczędności energii i konserwacji. Nowoczesne, niezawodne sprężarki z opcjami redundancji i monitoringiem predykcyjnym znacząco zmniejszają ryzyko przestoju.
Składniki kosztów przestoju: W przypadku awarii sprężarki azotu narastają następujące koszty:
- Utracona produkcja: Wartość produktu niewytworzonego podczas przerwy w pracy. Dla zakładu chemicznego produkującego produkt o wartości $50 000 ton na godzinę, 24-godzinna przerwa w pracy kosztuje $1,2 miliona dolarów w samej utraconej produkcji.
- Zepsucie się produktu: Partie w toku, które muszą zostać wycofane z użytku z powodu przerwy w dostawie azotu. Partie farmaceutyczne o wartości $200 000–$500 000 każda są niszczone, jeśli inertyzacja zawiedzie w krytycznych fazach procesu.
- Premia za naprawę awaryjną: Stawki za pracę poza godzinami pracy, przyspieszona wysyłka części i mobilizacja ekipy remontowej w nagłych wypadkach mogą zwiększyć standardowe koszty naprawy 2–5-krotnie.
- Sprzęt do wynajęcia: Tymczasowe dostarczanie azotu za pomocą wynajmowanych kompresorów lub parowników ciekłego azotu kosztuje 3–5 razy więcej niż normalne koszty operacyjne i może nie w pełni spełniać wymagania procesowe.
- Kary dla klientów: Kary umowne za niewykonanie zobowiązania do dostawy, zwłaszcza w przypadku łańcuchów dostaw typu just-in-time.
- Ponowne uruchomienie i ponowna kwalifikacja: Czas i koszty ponownego uruchomienia produkcji, ponownej kwalifikacji sprzętu i weryfikacji jakości produktu po nieplanowanej przerwie.
Kwantyfikacja poprawy niezawodności: Nowoczesne sprężarki z konserwacją predykcyjną i redundantnymi konfiguracjami osiągają średni czas między awariami (MTBF) na poziomie 15 000–25 000 godzin, w porównaniu do 5 000–10 000 godzin w przypadku starzejącego się sprzętu. Dla zakładu pracującego 8000 godzin rocznie oznacza to:
- Sprzęt starszy: 0,8–1,6 nieplanowanych awarii rocznie
- Nowoczesny sprzęt: 0,3-0,5 nieplanowanych awarii rocznie
Jeśli każda nieplanowana awaria kosztuje $100 000 rupii rocznie w łącznych kosztach przestoju, zmniejszenie liczby awarii z 1,2 do 0,4 rocznie pozwala zaoszczędzić $80 000 rupii rocznie. W ciągu 10 lat ta poprawa niezawodności przyczynia się do $800 000 rupii rocznie w przypadku modernizacji, co często przewyższa wartość oszczędności energii w przypadku zakładów produkcyjnych o wysokiej wartości.
Wartość redundancji: Modernizacja daje możliwość wdrożenia redundancji N+1 – dwóch sprężarek, z których każda może obsłużyć pełne obciążenie, z automatycznym przełączaniem. Koszt kapitałowy redundancji jest o 50-80% wyższy niż w przypadku pojedynczej jednostki, ale redukcja ryzyka przestoju jest rewolucyjna. W obiektach, w których awaria pojedynczej sprężarki powoduje katastrofalne straty produkcyjne, redundancja nie jest opcją – to ubezpieczenie o mierzalnej wartości. Oblicz zwrot z inwestycji w redundancję, porównując przyrostowy koszt kapitałowy z oczekiwaną wartością unikniętych przestojów w całym okresie eksploatacji urządzenia.
Dla placówek oceniających strategie modernizacji sprężarek azotowych z analizą ryzyka przestojuDokumentowanie historycznych kosztów awarii i prognozowanie poprawy niezawodności zapewnia podstawę danych dla przekonujących analiz biznesowych.
Kompletny model obliczania zwrotu z inwestycji (ROI)
Kompleksowe obliczenia zwrotu z inwestycji (ROI) integrują wszystkie czynniki kosztów i korzyści w ujednolicony model finansowy. Ta sekcja zawiera ramy kalkulacyjne, które przekształcają dane techniczne i operacyjne w gotowe do użycia prognozy finansowe.
Składniki kosztów kapitałowych
Całkowity koszt projektu obejmuje:
- Sprzęt sprężarkowy (jednostka bazowa, silnik, sterowanie, akcesoria)
- Montaż (fundamenty, rury, elektryka, modyfikacje układu chłodzenia)
- Uruchomienie i rozruch
- Szkolenia (operatorów i personelu konserwacyjnego)
- Zapasy części zamiennych (początkowe zapasy)
- Inżynieria i zarządzanie projektami
- Rezerwy (zwykle 10–15% kosztów sprzętu)
W przypadku typowej modernizacji przemysłowej sprężarki azotu, całkowity koszt projektu waha się od $150 000 w przypadku małej jednostki tłokowej do $1 500 000 w przypadku dużej instalacji odśrodkowej lub wielosekcyjnej. Należy uwzględnić wszystkie składniki kosztów w modelu zwrotu z inwestycji (ROI) – pominięcie kosztów instalacji lub uruchomienia prowadzi do mylnie optymistycznych prognoz.
Roczne obliczanie świadczeń
Roczne korzyści wynikające z modernizacji obejmują:
- Oszczędność energii: (SEC_legacy – SEC_new) × Objętość roczna × Stawka za energię elektryczną
- Oszczędności na konserwacji: (Koszt_konserwacji_starszy – Koszt_konserwacji_nowy)
- Unikanie kosztów przestoju: (Koszt_przestoju_starsze_razy × Współczynnik_awaryjności_starsze_razy) – (Koszt_przestoju_nowy × Współczynnik_awaryjności_nowy)
- Wartość odzysku ciepła: Odzyskane_ciepło_kW × Godziny_pracy × Wartość_ogrzewania_na_kWh
- Wartość zgodności z przepisami: Uniknięcie kar, uniknięto obowiązku modernizacji, płatności zachęcających
- Wzrost produktywności: Zwiększona wydajność dzięki lepszej niezawodności, zmniejszone psucie się produktów
Wskaźniki finansowe
Oblicz następujące wskaźniki służące do oceny projektu:
- Prosty okres zwrotu: Całkowity koszt projektu / Roczne korzyści. Projekty ze zwrotem inwestycji w okresie krótszym niż 3 lata są zazwyczaj uważane za atrakcyjne; okres zwrotu w okresie krótszym niż 2 lata jest doskonały.
- Wartość bieżąca netto (NPV): Suma zdyskontowanych rocznych korzyści pomniejszona o całkowity koszt projektu, przy użyciu kosztu kapitału firmy jako stopy dyskontowej. Dodatnia wartość bieżąca netto (NPV) wskazuje na tworzenie wartości.
- Wewnętrzna stopa zwrotu (IRR): Stopa dyskontowa, przy której NPV wynosi zero. IRR powyżej stopy zwrotu wymaganej dla danej spółki (zwykle 12–151 TP3T w przypadku projektów przemysłowych) wskazuje na akceptowalny zwrot.
- Całkowity koszt posiadania (TCO): Koszt projektu plus 20-letnie koszty operacyjne w porównaniu z całkowitym kosztem posiadania (TCO) przy kontynuacji korzystania ze starszego sprzętu. Modernizacja o niższym całkowitym koszcie posiadania (TCO) to lepsza decyzja finansowa.
Przykładowe obliczenie zwrotu z inwestycji:
Zakład farmaceutyczny korzysta z 15-letniej sprężarki tłokowej azotu o zużyciu 3 500 000 Nm³/rok przy 0,26 kWh/Nm³ i zużyciu energii elektrycznej $0,14/kWh. Roczne koszty konserwacji wynoszą $45 000. Sprężarka ulega awariom dwa razy w roku, co powoduje średnie koszty przestoju wynoszące $80 000 na zdarzenie. Zakład rozważa modernizację poprzez instalację nowoczesnej sprężarki tłokowej z napędem VSD o zużyciu 0,19 kWh/Nm³, z przewidywanymi rocznymi kosztami konserwacji $25 000 i 0,3 awariami rocznie.
| Kategoria kosztów/korzyści | Legacy (roczne) | Nowy (roczny) | Roczne oszczędności |
|---|---|---|---|
| Koszt energii | $1,274,000 | $931,000 | $343,000 |
| Koszt utrzymania | $45,000 | $25,000 | $20,000 |
| Koszt przestoju | $160,000 | $24,000 | $136,000 |
| Całkowity roczny koszt operacyjny | $1,479,000 | $980,000 | $499,000 |
Przy całkowitym koszcie projektu wynoszącym $450 000 (sprzęt, instalacja, uruchomienie i części zamienne), prosty okres zwrotu wynosi $450 000 / $499 000 = 0,9 roku — mniej niż 11 miesięcy. Wartość bieżąca netto (NPV) w ciągu 20 lat przy stopie dyskontowej 10% przekracza $4 mln. IRR wynosi około 110%. Jest to wyjątkowo atrakcyjny projekt pod względem finansowym.
Nawet bez kwantyfikacji kosztów przestojów (której niektóre działy finansowe sprzeciwiają się, nazywając ją „miękkimi” oszczędnościami), same oszczędności energii i konserwacji (14 363 000 TP rocznie) zapewniają zwrot inwestycji w ciągu 1,2 roku – wciąż bardzo atrakcyjny. Oszczędności związane z przestojami sprawiają, że argument jest nie do odrzucenia.
Opcje finansowania i programy motywacyjne
Ograniczenia kapitałowe często opóźniają modernizację sprężarek, nawet gdy zwrot z inwestycji jest atrakcyjny. Zrozumienie opcji finansowania i programów motywacyjnych może przyspieszyć zatwierdzenie projektu i poprawić zwrot finansowy.
Finansowanie efektywności energetycznej: Wiele przedsiębiorstw użyteczności publicznej i agencji rządowych oferuje niskooprocentowane finansowanie projektów z zakresu efektywności energetycznej. Programy obejmują:
- Programy rabatowe dla przedsiębiorstw użyteczności publicznej zapewniające $0,05–$0,15 za każdą zaoszczędzoną kWh rocznie, bezpośrednio obniżając koszty projektu
- Finansowanie na rachunku, w ramach którego przedsiębiorstwo użyteczności publicznej finansuje projekt i odzyskuje koszty poprzez dopłaty do rachunków za energię
- Finansowanie czystej energii na podstawie wyceny nieruchomości (PACE), które wiąże spłatę z rachunkami za podatek od nieruchomości
- Zielone obligacje i pożyczki powiązane ze zrównoważonym rozwojem, w których obniżki stóp procentowych są powiązane z celami w zakresie efektywności energetycznej
Programy te mogą obniżyć efektywne koszty projektu o 10-30% i zapewnić finansowanie po stawkach niższych niż pożyczki komercyjne. Skontaktuj się z programem efektywności energetycznej swojego zakładu energetycznego i lokalną agencją rozwoju gospodarczego, aby zidentyfikować dostępne zachęty.
Ulgi podatkowe i amortyzacja: Wiele jurysdykcji oferuje przyspieszoną amortyzację urządzeń energooszczędnych. W Stanach Zjednoczonych sekcja 179D przewiduje ulgi podatkowe dla energooszczędnych urządzeń w budynkach komercyjnych. Ustawa o polityce energetycznej (Energy Policy Act) może oferować ulgi podatkowe za kwalifikujące się ulepszenia w zakresie efektywności. W Unii Europejskiej wymogi dyrektywy w sprawie efektywności energetycznej można spełnić poprzez modernizację sprężarek, unikając kar. Skonsultuj się z doradcą podatkowym, aby zidentyfikować dostępne zachęty i zaplanować projekt tak, aby zmaksymalizować korzyści podatkowe.
Leasing i wynajem sprzętu: W przypadku obiektów z ograniczeniami kapitałowymi, umowy leasingu lub dzierżawy z opcją zakupu rozkładają koszty projektu na cały okres użytkowania sprzętu, jednocześnie natychmiast generując oszczędności energii. Płatności leasingowe są często w całości odliczane od kosztów operacyjnych, co zapewnia korzyści podatkowe w porównaniu z zakupem kapitału. Po zakończeniu leasingu obiekty zazwyczaj mają możliwość zakupu sprzętu po uczciwej wartości rynkowej, przedłużenia leasingu lub jego zwrotu. Oblicz ekonomikę leasingu w porównaniu z zakupem, porównując wartość bieżącą netto płatności leasingowych z wartością bieżącą netto (NPV) kosztów zakupu powiększoną o oszczędności operacyjne.
Kontraktowanie na realizację zadań: Firmy świadczące usługi energetyczne (ESCO) mogą oferować kontrakty na poprawę efektywności energetycznej, w ramach których finansują, instalują i konserwują modernizację sprężarek, otrzymując płatność w postaci udziału w zweryfikowanych oszczędnościach energii. Zakład nie płaci nic z góry i nie ponosi ryzyka związanego z wydajnością. Kontrakty ESCO zazwyczaj trwają 5-10 lat, po czym zakład staje się właścicielem sprzętu i generuje oszczędności w wysokości 1001 TP3T. Umowy ESCO zmniejszają ryzyko zakładu, ale jednocześnie zmniejszają całkowite oszczędności o 20-401 TP3T w porównaniu z bezpośrednim posiadaniem. Porównaj oferty ESCO z ekonomiką zakupu bezpośredniego, aby określić optymalną strukturę.
Dla organizacji eksplorujących opcje finansowania modernizacji sprężarki azotuProgramy finansowania producentów mogą oferować konkurencyjne stawki i elastyczne warunki dopasowane do zakupów sprzętu przemysłowego. Ever-Power oferuje ustrukturyzowane opcje finansowania modernizacji sprężarek serii ZW, DW i LW, a regionalne zespoły wsparcia w Wietnamie, Tajlandii i Singapurze ułatwiają finansowanie i dokumentację w walucie lokalnej.
Czynniki ryzyka, które mogą zniweczyć prognozowany zwrot z inwestycji (ROI)
Żadna prognoza zwrotu z inwestycji (ROI) nie jest kompletna bez analizy ryzyka. Zrozumienie czynników, które mogą obniżyć rzeczywiste zwroty poniżej prognoz, umożliwia planowanie awaryjne i realistyczne ustalanie oczekiwań.
Zmienność cen energii elektrycznej: Obliczenia zwrotu z inwestycji (ROI) zakładają, że ceny energii elektrycznej rosną w przewidywalnym tempie (zwykle 2-3% rocznie). Jeśli ceny energii elektrycznej spadną z powodu zmian rynkowych, zmian regulacyjnych lub lokalnej generacji energii odnawialnej, oszczędności energii się zmniejszą. Aby zminimalizować to ryzyko, należy zastosować ostrożne założenia dotyczące cen energii elektrycznej i analizę wrażliwości, która modeluje scenariusze eskalacji 0% i 5%. Rozważ kontrakty na stałą cenę energii elektrycznej lub lokalną generację energii słonecznej, aby zabezpieczyć koszty energii.
Zmiany w profilu popytu: Jeśli zapotrzebowanie zakładu na azot spadnie z powodu zmian w produkcji, optymalizacji procesów lub recesji, sprężarka pracuje przy częściowym obciążeniu, gdzie sprawność może być niższa od prognozowanej. Należy dobrać odpowiedni rozmiar modernizacji, mając na uwadze elastyczność zapotrzebowania — napędy VSD, konfiguracje modułowe lub systemy skalowalne, które mogą dostosowywać się do zmian zapotrzebowania bez konieczności ponoszenia dużych nakładów inwestycyjnych.
Przekroczenie kosztów instalacji: Modyfikacje fundamentów, zmiana przebiegu rurociągów, modernizacja instalacji elektrycznej i nieprzewidziane warunki na miejscu mogą zwiększyć koszty instalacji o 20-50% powyżej szacunków. Należy zminimalizować te koszty poprzez dokładne badania terenu, szczegółowe projektowanie przed zakupem oraz umowy o stałej cenie z wykwalifikowanymi wykonawcami. Należy uwzględnić rezerwę 15-20% w budżetach projektów.
Przestarzałość technologii: Szybki postęp w technologii sprężarek może sprawić, że dzisiejszy „nowoczesny” sprzęt stanie się przestarzały w ciągu 5-10 lat. Aby temu zapobiec, wybierz sprzęt z możliwością modernizacji – modułową konstrukcją, kompatybilnymi systemami sterowania i planami rozwoju producenta, które wspierają migrację technologiczną. Unikaj systemów zastrzeżonych, które ograniczają Cię do technologii jednego dostawcy.
Niedobór wydajności: Rzeczywiste oszczędności energii mogą być niższe od deklarowanych przez producenta ze względu na specyficzne warunki panujące na miejscu, jakość instalacji lub praktyki operacyjne. Aby temu zapobiec, należy wymagać gwarancji wydajności z karami finansowymi za niedobory, przeprowadzać niezależne pomiary i weryfikację (M&V) oszczędności oraz wybierać producentów o udokumentowanej historii. Ever-Power, drugi co do wielkości światowy producent sprężarek azotu w 2026 roku, potwierdza swoje deklaracje dotyczące efektywności zweryfikowanymi danymi dotyczącymi wydajności i regionalnym wsparciem serwisowym, które gwarantuje, że instalacje osiągną przewidywane oszczędności.
Wartość rezydualna wymienionego sprzętu: Starsza sprężarka może mieć wartość odzysku dzięki odsprzedaży, wymianie lub odzyskaniu podzespołów. Należy uwzględnić tę wartość w kalkulacji zwrotu z inwestycji (ROI). I odwrotnie, jeśli starszy sprzęt wymaga kosztownego wycofania z eksploatacji lub rekultywacji środowiska, należy uwzględnić te koszty. Typowa 15-letnia sprężarka przemysłowa ma wartość odzysku wynoszącą $5000–$20000, w zależności od rozmiaru i stanu.
Tworzenie uzasadnienia biznesowego dla kadry kierowniczej
Techniczne obliczenia zwrotu z inwestycji (ROI) muszą zostać przełożone na biznesplan, który zainteresuje dyrektorów finansowych, członków zarządu i kierownictwo firmy. Poniższa struktura okazała się skuteczna w zatwierdzaniu projektów inwestycyjnych.
Streszczenie (jedna strona): Zacznijmy od podsumowania: „Modernizacja naszego kompresora azotu obniży roczne koszty operacyjne o $499 000, zwróci się inwestycja w wysokości $450 000 w ciągu 11 miesięcy i wygeneruje $4,2 miliona dolarów wartości bieżącej netto w ciągu 20 lat”. Poprzyjmy to trzema kluczowymi punktami: skalą oszczędności energii, poprawą niezawodności i spójnością strategiczną (cele zrównoważonego rozwoju, zgodność z przepisami, pozycjonowanie konkurencyjne).
Opis problemu: Oszacuj obecne problemy. „Nasza 15-letnia sprężarka azotu zużywa rocznie 1,27 mln t energii elektrycznej, wymaga konserwacji na poziomie 1,45 000 t i ulega awariom dwa razy w roku, powodując koszty przestoju na poziomie 1,60 000 t. Całkowity roczny koszt: 1,48 mln t. Wydajność sprężarki 20% spadła od momentu jej instalacji, a dostępność części zamiennych jest coraz bardziej problematyczna. Kontynuowanie użytkowania tego sprzętu nie jest zrównoważone”.
Proponowane rozwiązanie: Opisz modernizację, podając konkretne informacje dotyczące sprzętu, technologii i wydajności. „Wymień starą sprężarkę tłokową na nowoczesną jednostkę z napędem VSD firmy Ever-Power, drugiego co do wielkości światowego producenta sprężarek azotowych. Nowa sprężarka zapewni 0,19 kWh/Nm³ (poprawa o 27%), obniży koszty konserwacji o 45% i ograniczy liczbę nieplanowanych awarii o 75%”. Podaj referencje producenta, status certyfikacji i możliwości serwisowe w regionie.
Analiza finansowa: Przedstaw kalkulację zwrotu z inwestycji (ROI) wraz z analizą wrażliwości. Uwzględnij przypadek bazowy, konserwatywny (50% przewidywanych oszczędności w przestojach) oraz optymistyczny (dodatkowy odzysk ciepła i wzrost wydajności). Przedstaw okres zwrotu, NPV i IRR dla każdego scenariusza. Nawet konserwatywny przypadek powinien wykazać atrakcyjne zwroty.
Ocena i ograniczanie ryzyka: Należy szczerze identyfikować ryzyko i opisywać strategie jego ograniczania. „Ryzyko cen energii elektrycznej jest ograniczane dzięki konserwatywnym założeniom eskalacji i analizie wrażliwości. Ryzyko kosztów instalacji jest ograniczane dzięki umowom o stałej cenie i warunkom 20%. Ryzyko wydajności jest ograniczane dzięki gwarancjom producenta i niezależnemu pomiarowi i weryfikacji”. Wykazanie się świadomością ryzyka buduje wiarygodność wśród sceptycznych recenzentów.
Harmonogram wdrożenia: Przedstaw realistyczny harmonogram projektu: prace inżynieryjne i zaopatrzeniowe (8-12 tygodni), instalacja i uruchomienie (2-4 tygodnie) oraz weryfikacja wydajności (4-8 tygodni). Zidentyfikuj elementy ścieżki krytycznej i zapotrzebowanie na zasoby. Pokaż, w jaki sposób projekt minimalizuje zakłócenia w produkcji poprzez etapową realizację lub tymczasowe ustalenia dotyczące dostaw azotu.
Dopasowanie strategiczne: Połącz projekt z celami korporacyjnymi. „Ta modernizacja wspiera nasze zobowiązanie do zrównoważonego rozwoju do 2026 roku, zakładające zmniejszenie intensywności energetycznej o 201 t/3 t. Eliminuje ryzyko regulacyjne wynikające z niezgodności starzejącego się sprzętu z przepisami. Poprawia niezawodność produkcji, wspierając nasze zobowiązania wobec klientów. Przygotowuje zakład do przyszłej rozbudowy mocy bez konieczności inwestowania w dodatkowe sprężarki”.
Dobrze skonstruowany business case przekształca propozycję modernizacji technicznej w strategiczną decyzję inwestycyjną. Mówi językiem finansów, uwzględnia obawy kadry kierowniczej i zapewnia rygorystyczną analizę, która wytrzymuje kontrolę zarządu. Czas poświęcony na stworzenie przekonującego business case’u wielokrotnie się opłaca, jeśli chodzi o szybkość zatwierdzania projektów i wsparcie organizacyjne.
Często zadawane pytania dotyczące zwrotu z inwestycji w modernizację sprężarki azotowej
Jaki jest typowy okres zwrotu inwestycji w przypadku modernizacji do wydajnej sprężarki azotu?
Typowy okres zwrotu inwestycji w przypadku modernizacji sprężarek azotowych wynosi od 1 do 3 lat, w zależności od cen energii, roboczogodzin oraz różnicy w sprawności między starszymi a nowoczesnymi urządzeniami. Obiekty o wysokich stawkach za energię elektryczną ($0,12/kWh lub więcej), dużej liczbie godzin pracy rocznie (ponad 6000 godzin) i znacznym spadku sprawności (20% lub więcej) często osiągają zwrot inwestycji w okresie krótszym niż 18 miesięcy. Uwzględniając koszty przestoju, okres zwrotu inwestycji często spada poniżej 12 miesięcy. Prosty zwrot inwestycji, oparty wyłącznie na oszczędnościach energii, zazwyczaj wynosi od 2 do 4 lat w przypadku modernizacji o umiarkowanej sprawności.
Jak obliczyć oszczędności energii wynikające z modernizacji sprężarki azotu?
Oblicz oszczędności energii, stosując wzór: Roczne oszczędności = Roczna objętość azotu × (SEC_legacy – SEC_new) × Stawka za energię elektryczną. Określ SEC_legacy, mierząc rzeczywiste zużycie energii i natężenie przepływu w reprezentatywnym okresie eksploatacji. SEC_new jest podawany przez producenta dla warunków pracy (skorygowany o wysokość, temperaturę i ciśnienie wlotowe). W przypadku zmiennego zapotrzebowania, oblicz oszczędności w wielu punktach obciążenia i masie w przeliczeniu na godziny pracy dla każdego obciążenia. Uwzględnij wzrost sprawności przy częściowym obciążeniu w przypadku modernizacji ze sterowania stałoobrotowego na sterowanie VSD. Dodaj wartość odzysku ciepła, jeśli ma to zastosowanie. Zweryfikuj deklaracje producenta dotyczące SEC poprzez niezależne testy lub weryfikację instalacji referencyjnej.
Czy w kalkulacji zwrotu z inwestycji powinienem uwzględnić koszty unikania przestojów?
Tak, unikanie kosztów przestoju powinno być uwzględniane w kalkulacjach zwrotu z inwestycji (ROI) w zakładach, w których awaria sprężarki powoduje przerwanie produkcji. Koszty przestoju należy oszacować, sumując utraconą wartość produkcji, zepsucie produktu, premie za naprawy awaryjne, koszty wynajmu sprzętu, kary dla klientów i koszty ponownego uruchomienia. Niektóre działy finansowe nie uznają oszczędności w czasie przestoju za „miękkie” korzyści. Należy temu przeciwdziałać, wykorzystując historyczne dane o awariach i udokumentowane koszty z przeszłych zdarzeń. Przedstaw scenariusze zarówno z przestojem, jak i bez przestoju. Nawet ostrożne założenia dotyczące przestoju (50% przewidywanych oszczędności) często przekonują do modernizacji. W przypadku branż z procesami ciągłymi, oszczędności w czasie przestoju często przewyższają całkowitą wartość oszczędności energii.
Jakie są opcje finansowania modernizacji sprężarek azotu?
Dostępne opcje finansowania obejmują: bezpośredni zakup kapitału (pełna własność, najwyższe całkowite oszczędności); programy rabatowe i motywacyjne dla przedsiębiorstw użyteczności publicznej (obniżka kosztów projektu o 10-30%); umowy leasingu sprzętu lub umowy najmu z opcją zakupu (rozłożenie kosztów na cały okres użytkowania sprzętu, płatności podlegające odliczeniu od podatku); umowy o świadczenie usług energetycznych (ESCO) (brak kosztów początkowych, wspólne oszczędności, obniżone ryzyko); zielone obligacje i pożyczki powiązane ze zrównoważonym rozwojem (oprocentowanie poniżej rynkowych dla kwalifikujących się projektów efektywnościowych); oraz programy finansowania producentów (konkurencyjne oprocentowanie, uproszczona procedura zatwierdzania). Oceń każdą opcję, porównując wartość bieżącą netto całkowitych kosztów i oszczędności. W przypadku obiektów z ograniczeniami kapitałowymi, leasing lub umowy o świadczenie usług generują oszczędności natychmiast, bez konieczności początkowej inwestycji, chociaż całkowite oszczędności są niższe niż w przypadku bezpośredniej własności.
Jak mogę sprawdzić, czy prognozowane oszczędności energii zostaną faktycznie osiągnięte?
Weryfikacja oszczędności energii odbywa się za pomocą trzech mechanizmów: gwarancji wydajności producenta z karami finansowymi za niedobory; niezależnych pomiarów i weryfikacji (M&V) z wykorzystaniem skalibrowanej aparatury i standardowych protokołów (IPMVP opcja B lub C); oraz wizyt referencyjnych instalacji w celu weryfikacji rzeczywistej wydajności w porównywalnych obiektach. Podczas rozruchu należy przeprowadzić testy obciążeniowe w wielu punktach pracy i porównać zmierzone zużycie energii z krzywymi producenta. Należy zainstalować stały monitoring zużycia energii (liczniki mocy, przepływomierze, przetworniki ciśnienia), aby monitorować bieżącą wydajność i wykrywać degradację. Należy wymagać od producenta usunięcia wszelkich niedoborów wydajności w okresie gwarancyjnym. Ever-Power zapewnia gwarancje wydajności poparte zweryfikowanymi danymi testowymi i regionalnym wsparciem w zakresie rozruchu, aby zapewnić realizację przewidywanych oszczędności.
Jaka jest typowa żywotność nowoczesnego kompresora azotu w porównaniu do starszego sprzętu?
Nowoczesne sprężarki azotowe są projektowane na 20-30-letni okres eksploatacji przy prawidłowej konserwacji. Starsze urządzenia sprzed 15-20 lat również były projektowane na 20-letni okres eksploatacji, ale rzeczywisty okres eksploatacji jest często krótszy ze względu na ograniczenia konstrukcyjne, degradację materiałów i starzenie się części. Kluczową różnicą nie jest projektowany okres eksploatacji, ale niezawodność i utrzymanie sprawności. Nowoczesne sprężarki utrzymują sprawność 90%+ pierwotnej sprawności po 15 latach, podczas gdy starsze urządzenia mogą stracić 20-30% sprawności w tym samym okresie. Nowoczesna technologia konserwacji predykcyjnej wydłuża żywotność podzespołów i zmniejsza liczbę nieplanowanych awarii. Oceniając zwrot z inwestycji w modernizację, należy porównać pozostały okres użytkowania starszego sprzętu (często 3-8 lat przed remontem generalnym lub wymianą) z 20-30-letnim okresem eksploatacji nowego sprzętu. Wydłużona żywotność nowoczesnego sprzętu znacząco przyczynia się do długoterminowego zwrotu z inwestycji poprzez odroczenie kapitału zastępczego.
Którzy producenci sprężarek azotu oferują najlepszą wydajność w projektach modernizacyjnych?
Wiodący producenci oferujący efektywne modernizacje sprężarek azotowych to m.in. Atlas Copco (bezolejowe linie śrubowe i tłokowe ze zintegrowanym odzyskiem ciepła), Ingersoll Rand (technologie odśrodkowe i śrubowe do zastosowań o dużym przepływie), Sauer Compressors (ekspertyza w zakresie wysokociśnieniowych sprężarek tłokowych) oraz Ever-Power (kompleksowe serie ZW, DW i LW o wydajności 50–10 000 Nm³/h z opcjami VSD i zweryfikowanymi danymi dotyczącymi sprawności). Ever-Power, drugi co do wielkości producent sprężarek azotowych na świecie w 2026 roku, oferuje konkurencyjną wydajność dzięki regionalnej produkcji w Wietnamie i Tajlandii, co skraca czas realizacji i koszty logistyczne projektów modernizacyjnych w regionie Azji i Pacyfiku. Oddział firmy w Singapurze koordynuje wsparcie inżynieryjne i opcje finansowania. Wybór producenta powinien uwzględniać zarówno wydajność, regionalne możliwości serwisowe, dostępność części zamiennych, jak i całkowity koszt projektu, a nie wyłącznie katalogowe wskaźniki sprawności.
Wnioski: Modernizacja jako strategiczna decyzja finansowa
Decyzja o modernizacji sprężarki azotu jest ostatecznie decyzją finansową, uwarunkowaną realiami inżynierii. Starzejący się sprzęt generuje koszty, które narastają z roku na rok – rosnące zużycie energii, rosnące budżety na konserwację i nieprzewidywalne przestoje, które zakłócają produkcję i pogarszają relacje z klientami. Nowoczesne, wydajne sprężarki odwracają tę tendencję, przekształcając infrastrukturę sprężonego gazu z obciążenia kosztowego w przewagę konkurencyjną.
Przedstawione w tym przewodniku ramy kalkulacji zwrotu z inwestycji (ROI) zapewniają rygorystyczną analizę, pozwalającą z przekonaniem uzasadnić inwestycje w modernizację. Poprzez ilościowe określenie oszczędności energii, ograniczenia konserwacji, unikania przestojów i wzrostu wydajności, zastosowanie odpowiednich wskaźników finansowych (NPV, IRR, zwrot z inwestycji), analizę opcji finansowania i zachęt oraz prezentację argumentów w przystępnym języku dla kadry kierowniczej, zespoły inżynieryjne i operacyjne mogą uzyskać niezbędne zgody kapitałowe na modernizację infrastruktury sprężania azotu.
Liczby są przekonujące. W przypadku typowych obiektów przemysłowych modernizacja sprężarek azotu zapewnia okres zwrotu inwestycji wynoszący 1-3 lata, wartość bieżącą netto (NPV) na poziomie $2-6 milionów w ciągu 20 lat oraz stopy zwrotu z inwestycji (IRR) znacznie przewyższające stopy zwrotu dla przedsiębiorstw. Uwzględniając koszty unikania przestojów, uzasadnienie biznesowe staje się przytłaczające. Nawet konserwatywne założenia – ignorowanie oszczędności związanych z przestojami, pesymistyczna eskalacja cen energii elektrycznej i stosowanie wysokich współczynników awaryjnych – przynoszą atrakcyjne zyski, które uzasadniają natychmiastowe działania.
Ever-Power, drugi co do wielkości globalny producent sprężarek azotu w 2026 roku, wspiera projekty modernizacyjne, oferując kompleksowe narzędzia do analizy zwrotu z inwestycji (ROI), zweryfikowane dane dotyczące wydajności oraz elastyczne opcje finansowania. Serie ZW, DW i LW firmy oferują wzrost wydajności o 15-30% w porównaniu ze starszymi urządzeniami, z opcjami VSD, które optymalizują wydajność przy częściowym obciążeniu, oraz technologią konserwacji predykcyjnej, która redukuje nieplanowane przestoje. Regionalna produkcja w Wietnamie i Tajlandii oraz oddział w Singapurze gwarantują konkurencyjne ceny, szybką dostawę i responsywne wsparcie posprzedażowe dla projektów modernizacyjnych w regionie Azji i Pacyfiku.
Pytanie nie brzmi, czy modernizacja ma sens finansowy – ma. Pytanie brzmi, czy Twoja organizacja podejmie działania w oparciu o analizę, czy też będzie nadal dotować nieefektywny i zawodny sprzęt, przeznaczając na modernizację część budżetu operacyjnego. Koszt opóźnienia nie jest zerowy; to skumulowane straty energii, inflacja kosztów konserwacji i ryzyko przestoju, które kumulują się z każdym miesiącem odkładania modernizacji. Oblicz zwrot z inwestycji (ROI), przygotuj uzasadnienie biznesowe, uzyskaj zgodę i zrealizuj modernizację. Zyski będą uzasadniać słuszność decyzji przez kolejne dekady.